1. Preface
If you're an indie game developer, you must've heard it a thousand times. Analytics is crucial! Measure everything! Analytics is the key to quickly identify what's wrong with your game and what you should do to improve it. All you have to do is include SDK library into your code and win!
Right?
Well, kinda...
While most of the above holds true (except straightforward 'win'), our experience with analytics showed us that it seemed much simpler than it actually is. No surprise there huh? We did get many new insights into the process and some of its often omitted, but extremely challenging components.
In this lengthy post, I'll try to share our experience with adding analytics to Sharp Minds and everything we've learned from it.
2. Quick takeaways
For those unwilling to endure my entire ramble, some quick takeaways first (if in tl;dr mode - jump straight to conclusion).

What is Analytics anyways?
Strictly put, 'analytics' is discovery of meaningful insights within data. Usually it is a computationally intensive process requiring computers. Data sets can get really huge. Increasing computational power allows more and more application of analytics in every aspect of life and business. We will focus on game analytics and more specifically - mobile game analytics.
In game industry, analytics is accepted term for recording important data about player behaviour/play and analysing that data to find various problems or bottlenecks in a game. Discovered problems are then corrected and game is updated. New data is used to verify if changes have been successful at correcting problems.
Even though correction of the problems is not considered part of the analytics, I think it is crucial to treat it as an essential part of analytics process. Without it, analytics is pretty much wasted development time.
Lets shoot down some myths:
Implementing analytics in your game means integrating some analytics platforms SDK into your code.
Nope. That's just the first and one of the easier steps in the analytics process.
Event reporting is trivial, just send 'start-level', 'end-level' and similar events when they happen.
While you could keep your event reporting from game as bare as possible and then do all calculation within the resulting data set, sometimes you can save a lot of time and complexity making reporting a bit more intelligent and send some context data.
For example: 'start-level' event could contain (besides which level is in question) attempt number for the level. Attempts can be calculated without this data by counting sequential level starts by the player for the level, but it is a very expensive analytics computation. It is much simpler to include attempt number along with event in the first place.
If I record every event possible in my game, analytics platform will give me valuable insights into what needs changing.
Probably a common misconception. While analytics platform and its sometimes rich and fancy charts might show you the most glaring problems within your game, mostly it will look like a pile of meaningless data. You won't be able to extract any kind of actionable information from it yet. Most challenging work begins right here.
I don't need an existing analytics platform, I'll just put up my own server and have full control of data and processing.
'I'll do this common thing myself' is a big NO-NO for indies in general. Analytics is no exception. The core of analytics is indeed simple. Just collect some key/value pairs over a REST API or something, but the breadth and depth of detail is enormous; availability, scaling, error handling, computation, data storage, redundancy, etc. You don't want to waste your valuable time on any of this.
If I get my analysis and charts right, bottlenecks and problems within the game will be obvious.
This truly IS the goal of analytics. But be prepared for lots of exceptions in the data. The fewer download numbers are, more volatile will be your data. If you have 10 downloads/day, a single article about you on some portal will increase this number several fold for a day or two. Your numbers will be skewed. Now imagine you have a strategy game. If you get featured on a strategy portal, new players will exhibit completely different behaviour on average than if you had been featured in some daily news portal. Every external event will skew your data. This problem, of course, diminishes once you get a stable and relatively high amount of organic new installs.
Ok, but when I account for all those exception, the remaining analytics data will give me a clear info on what to do.
Eh, not always. There is a gap between knowing the problem, and knowing the cause of the problem (thus being able to come up with the appropriate solution) and you will have to do some thinking and guesswork to bridge that gap. For example, if many of your players are leaving at level 4, it is obvious that there is a problem with user experience at that level (or all gameplay up to that level). You still don't know what's causing it. Now if you dig deeper and find out that people are leaving without having solved level 4 even after multiple attempts, you'll get closer to truth. Now the problem might be that level 4 is simply too difficult OR tutorial leading to that level is unclear so players have no clue what to do. When digging deeper is no longer an option, you'll just have to guess, implement solution based on your best guess and see what happens in the next version.
Finding info within reported data is a discrete computational process.
It is not and you shouldn't care. Analytics is about statistics and probability. You don't care about how many players (or percent of players) are leaving the game at level 4. 80% is equivalent information to 75% or 85%, so don't get bogged down in details. You always have to look out for errors in reporting or analytics which could creep and exponentially grow to give completely inaccurate results, but besides that, exactness of numbers is not really important.
3. Choosing the platform
One of the first things you'll face is choosing the analytics platform. There are several things to consider:
a. Ease of integration (SDK library)
This criterion was my first consideration. I'm still not sure if that's completely wrong, but in the long run it is questionable. You should aim for analytics which natively supports your game's target platform or for which a well-established library exists. If you are targeting multiple platforms than this becomes even more important. You don't want to be surprised by the fact that Android is supported, but iOS is not, or vice versa. Since I was using Unity, and have had great prior experience with Prime31 native plugins, my choices were Flurry and Localytics. Many analytics platforms will also go to great lengths to make integration easy, so many have Unity3D support provided (for example Google Mobile Analytics has a Unity3D plugin) and those which haven't require very little native code to be written in order to integrate.
For us, it boiled down to Flurry, Localytics and Google Mobile Analytics as three most obvious and most feasible solutions.
b. Price
Pricing is a tricky business. Localytics, for example, is free up to 10k MAU (monthly active users). This seems fine at first glance, because once you get over 10k MAU, you should be doing fine financially. Not so in our case. Sharp Minds is still free and even if it wasn't it wouldn't be earning enough money to justify $200 per month which is the lowest Localytics price point. And with our modest downloads, we did have peaks which approached 10k MAU.
Regardless, I was very curious because Localytics seemed very professional so we didn't eliminate it on account of pricing. Flurry and Google are free. For Google that kinda makes sense, because it is a natural expansion of their existing and very powerful web analytics platform. For Flurry not so much, so big kudos to Flurry for keeping it free.
c. API features
 This is where I made my first big mistake. At first glance it seemed to me that none of the platforms provided enough reporting features to satisfy our analytics needs, so I in advance decided that we needed raw data access and that we will process this data ourselves.
Funny thing was, that at the time Localytics website advertised raw API access, but when I inquired about the details of the API usage they gave me a very weird 'that is classified' response. How can something I'm basing my choice on be classified. 'Because someone might steal our API specs'. What?!? That was so weird and unbelievable that I scratched Localytics from my list.
Flurry did provide a very rude raw data access via exports, so I knew I could somehow use that. Google didn't bother with addressing the issue at all and I mistakenly saw that as a flaw and chose Flurry as my platform.
Lesson learned:
Avoid accessing and processing of raw data if you can help it. You'll be able to do wonders, but soon two things will come and bite your almighty behind:
a) Raw data will become too huge to handle. Sure, while under 10K MAU it's probably manageable, but we want worldwide success don't we? Once we get that, your crummy code and free cloud storages won't be able to handle raw data. From what I learned it seems that Google goes even further; it processes just a sample of the raw data, enough to be representative. That is how it maintains speed and features.
b) As you add features and optimizations, your code will grow and eventually (like every other live code) this entire sub-project will drain too many of your precious indie hours away from your game
d. Reporting features/customizations
Localytics seemed very rich at this, but it dropped due to their API secrecy (recent quick glance at their docs led me to believe they fixed this issue). Flurry had decent built-in reports, but every other kind of custom query was extremely limited and took too long to process. Luckily for us, in the meantime Yahoo acquired Flurry and they have since added a beta 'Explorer' - a VERY cool real-time, ad-hoc analytics reporting. You are clicks away from pretty complex queries across your entire data set. I've played a bit with it and I was quite impressed with how it works.
I took a peek at Google and it all seemed too much hurdle. There were tons of APIs for various queries which I didn't understand and custom reports in analytics console seemed extremely complex to configure.
Lesson learned
Flurry's Explorer aside, I think I should've chosen Google, because I dismissed it on the wrong basis. Even with Flurry's Explorer addition, Google's approach and mindset to analytics seems much clearer now that I've learned much about it. Flurry is still a decent choice, but I'll try Google Analytics at first next opportunity and I'm pretty convinced that it'll be the right long-term choice.
Besides these three there are plethora of new analytics startups out there to chose from. For Unity3D users, Unity also launched its own analytics platform. It stills seems too basic, but I'm sure it will grow.
4. The Analytics Process
In lack of better term, we'll use 'Analytics Process' as a series of steps required to fully benefit from implementing analytics into your game development lifecycle. It is important to distinguish this process from one of its steps we can read so much about: integrating analytics into your code. While that step is mandatory, it doesn't mean anything by itself.
If you plan to only do that single step, I strongly advise that you don't bother with analytics at all, because you won't benefit from it. Better spend that precious development time elsewhere.
What follows is implementation of the process for our puzzle game 'Sharp Minds', with all its issues and mistakes.
a. Decide what key game use cases you want to include in analytics (Difficulty: 10/100)
It's much easier to choose reporting events if you know what kind of queries you'll perform on your data set afterwards. However, you should accept that you can't really plan for that. The power of ad-hoc reporting is that it is ad-hoc. You will want to come up with new ideas on what questions to ask yourself (and your data). It's best to settle to being detailed and consistent in reporting. Report as many as possible atomic events for you central game mechanics.
Don't report multi-event actions (for example two or three consecutive reporting events describing one logical game event), they will be extremely difficult to process and query.
Structure your events, so they share as much as possible same parametric data (think base classes and inheritance, you're all coders right?). This will allow for much easier queries among different event types.
Always report timestamp, playerId, appVersion (don't forget this one!) and sessionId with your event. Most platforms will do that automatically or provide easy means for you to do so. PlayerId should be anonymous Ids as stores only allow you to report those. You can use target platforms' provided advertising ids or just create your own on first use (I love guids so I use Guid.NewGuid() all the time)
Examples:
Sharp Minds level based events had these parameters: level, exStars (prior best score for the level), starsTotal (total player stars - this allowed for many total score related queries), attempt (attempt number for this level).
Additionally LevelEnd event had: moves (moves used), stars (score on this play), playTime (level play length).
Other classes of events had some other parameters, but we tried to keep total set of different possible parameters minimal. Besides, when reporting a Flurry event, you can send max. 10 custom parameters.
Examples of events: LevelStart, LevelRestart, LevelFail, LevelComplete, ShareAsked, SkipAsked, RateAsked, GameServicesLogin, MainMenuButton (this class of events covered what players choose on main menu screen, which can then be cross-referenced with their current game progress), etc.
b. Choose service provider and integrate analytics event reporting into your code (Difficulty: 10/100)
As explained earlier I opted for Flurry Analytics and used Prime31 native plugins for both iOS and Android. To some they might seem costly ($50 each), but Prime31 is doing a good job at keeping them simple and updated. Besides, your development time is precious and you'd spend hours and days working out the quirks of such native code. If you can afford it, just buy it.
What I consider essential is to create a platform independent layer of code in your game. Your game should know WHAT it wants to report to analytics and that is all that should be exposed throughout majority of your code. HOW it is reported should be hidden behind a interface - provider (or any other design pattern serving the same purpose). This enables several useful things down the road. For example, you can easily write text-log analytics provider for testing purposes, or switch to another analytics platform without having to modify events throughout your code.
c. Process and analyse reported metrics and extract actionable information (Difficulty: 60/100)
For us, this was by far the most difficult part of the cycle. A lot of that had to do with the fact that we chose to process the raw data ourselves for majority of the reports. Even if we hadn't, this would still be the most challenging part of the process and this came as the biggest surprise.
Now it's quite possible that you're asking yourselves 'What is he talking about? All the important charts are available via platform already.' If you are, you're quite wrong. Analytics platform will provide you with basic data like daily sessions, MAUs, DAUs and some form of retention tracking. Any deeper and more contextual question poses quite a challenge. Before I explain why, let me tell you about a...
 ...cool thing called Funnel.
As you probably already figured out, Sharp Minds is a puzzle game. Progress is simple, you solve puzzles level by level and earn 1, 2 or 3 stars for each completed level. Funnel is a series of sequential criteria (steps) every user tries to pass through. Example of funnel would be:
step 1. User failed level L1-9
step 2. User completed level L1-9 with 3 stars
L1-9 denotes level 9 in chapter 1. We will use this notation to represent levels.
This funnel would check for players who have first failed level L1-9 and then, sometimes in the future completed that level with 3 stars. Processing data with a funnel such as this actually counts the number of players who pass all of the criteria. So if you filter your data to report only players who have failed level L1-9 (filter is enough, don't need funnel for 1 criteria) and apply the above funnel, you'd get a percentage of those who have completed it with 3 stars within all those who have failed L1-9.
You can do cool things with funnels. For example, let's say we ask users to rate our game after L1-10. You could define funnels:
Funnel 1:
step 1. User completed L1-10 with 1 stars
step 2. User accepted to rate the game
Funnel 2:
step 1. User completed L1-10 with 3 stars
step 2. User accepted to rate the game
Comparing number of players between these funnels would give you a clear info on how much number of stars won just before the rate question affects users willingness to rate the game.
Most analytics platforms support some form of funnels. As usual, the devil is in the details. For example, when we started out, Flurry did have funnels, but they didn't support custom parameters. So basically all LevelComplete events are treated as same (you couldn't insert a criteria to check for specific level). Making a different event for each level won't work either since there is a limit on the number of different events Flurry will process.
In the meantime Flurry has added aforementioned Explorer Beta, which supports parametric funnel steps. Cool, huh? Well, consider this useful question: 'How many players have completed L1-5 through L1-8 without failing once?'. Funnel would look something like this:
step 1. User completed L1-5
step 2. User didn't fail a level
step 3. User completed L1-6
etc..
For this to work, funnel has to support negation of its criteria. As far as I know, Flurry doesn't support this. Based on some preliminary research Google Analytics does. Cool, huh? Well, consider this even more useful question: 'At which level do players stop playing?'. Or even better: 'I want a breakdown of top ten levels as last level played for players.'
 This question is crucial, because it will give you a lot of information about specific levels which are too boring or too difficult and causes majority of players to leave. BIG problem is there is NO EVENT for 'player stops playing'. I don't know how to express this in Funnel criteria terms. Even if I could, there still a problem of players who have just played a few hours ago. I don't want to count them among those who stopped playing just because there are no events after the last level they just played.
I'm pretty certain that most analytics platforms do not support this query/funnel nor many more complex ones you can think of (except maybe Google Analytics which I haven't researched enough to know). Unfortunately, these are the ones that can bring most value to your analytics process.
All of this is the reasoning behind going for raw data import and custom processing. Big players in game industry probably do their own analytics for similar reasons. I had a custom sequential processor in place which kept calculating all important metrics for our game as events arrived. Reporting was fast and powerful, but in retrospect - this solution is too costly for indies.
d. Implement changes into your product based on extracted information (Difficulty: 20/100)
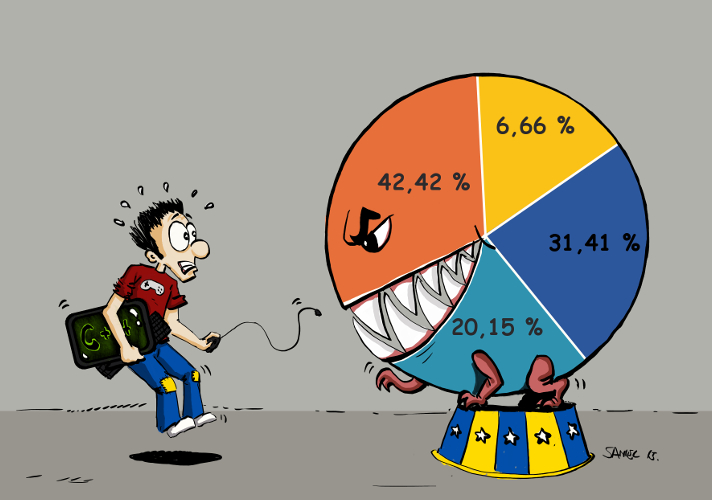
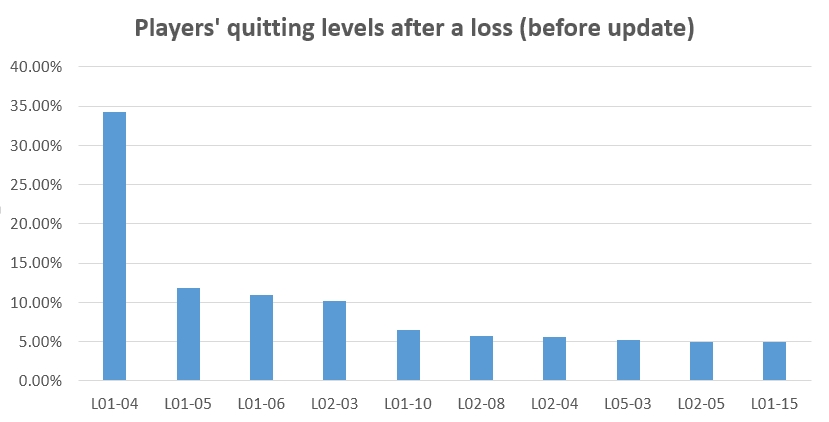 When you have ad-hoc analytics in place, next thing you'll do is ask yourself and your reporting system many questions and you should look for suspicious data. That is data which doesn't conform to some normal or expected distribution. Our analytics enabled us to correct many things in the update, for example our top 10 quitting levels (out of 400 total levels or nearly 100 average played levels) after a loss
caused almost 40% of players to quit. This wasn't good - there was obviously something wrong with these levels. Even among these 10 levels, one level had an extremely high quit rate.
When you have ad-hoc analytics in place, next thing you'll do is ask yourself and your reporting system many questions and you should look for suspicious data. That is data which doesn't conform to some normal or expected distribution. Our analytics enabled us to correct many things in the update, for example our top 10 quitting levels (out of 400 total levels or nearly 100 average played levels) after a loss
caused almost 40% of players to quit. This wasn't good - there was obviously something wrong with these levels. Even among these 10 levels, one level had an extremely high quit rate.
So we debated why this is so. Since top quitting levels after a loss have been L01-04, L01-05 and L01-06 - we concluded that it couldn't be the difficulty that was the issue, because the levels were trivial. The only remaining conclusion was that our tutorial sucks and that players are quitting because they have no clue how to play the game.
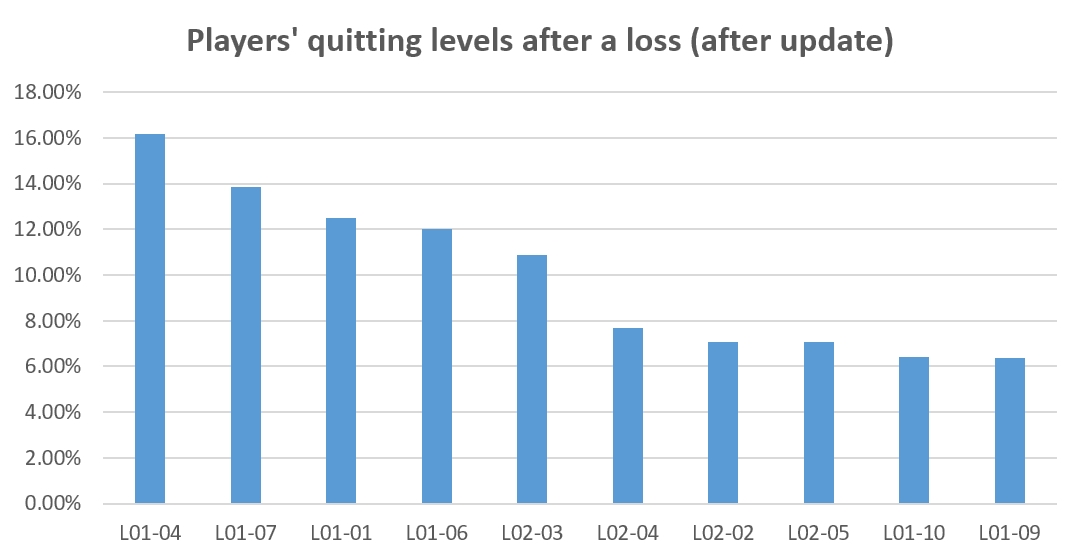
In the update, we put a lot of effort towards improving tutorial and it payed off. Comments like 'it's confusing' completely went away and top 10 quitting levels distribution changed a lot. Their total dropped from 40% to 30% and they were more evenly distributed.
We also did a lot of tuning on very easy and very difficult levels throughout the game. Here are a few analysis we used for this:
Analysis of difficult and easy levels
Analysis of players' quitting levels
5. Conclusion
Do not underestimate the analytics process endeavour!
If you only want to track your Sessions, DAUs and MAUs, almost any analytics platform will do. If you want to be able to do ad-hoc queries and dig deep into your data, you should choose your tools carefully and do a lot of research prior to committing to a platform.
Structure your client-side event reporting thoughtfully, because good event design and smart additional data with events can save you a lot of trouble during analytics processing and reporting. If you're looking to spend only a few hours on your analytics, I'd advise to completely skip it, because you won't get any real value. Do not do your own data collection and processing, it will be too costly down the road.
Hopefully our experience, our good and our bad decisions will help you do a better analytics yourself and allow you to continually improve your game.
Thanks for reading!